
TRENDS IN OZONE AND ITS PRECURSORS
This section shows how the annual national and regional
average levels of ozone and its precursors (NO, NO2, and VOC) have
varied over time. It also provides an
estimation of the trends in these annual averages. The annual average for a given year is simply
the average of all the considered station-specific values for that year (for
both regional and national averages). These
averages are based on data from monitoring stations with a 75% data capture over
the period considered. The ozone
averages are based on data from monitoring stations in both urban and non-
urban areas, while for NOx and VOC, only stations located in urban
areas were considered (primarily because most measurements of NOx
and VOC occur in urban areas).
The values of the regional and national annual averages vary
from year to year as the ambient levels react to changing conditions such as
emissions and meteorology. Despite this
variation, there may have been an overall upward or downward tendency in these
values. This tendency is typically
qualified by the slope (the rate of change) of a linear line fitted through the
actual values, and it is this slope and the direction of change in values (increasing or decreasing) that is
referred to as the trend.
In this report, the trend is estimated by applying the Sen’s
Non-parametric Estimator of Slope. The
Sen method was also used to test if a trend was statistically different from
zero at the 95% confidence level. A non-statistically
significant trend means that random variations alone may have been responsible
for the trend and, as such, there is likely no systematic trend in levels. For this report, only the direction of the
trend is indicated and trends that are not statistically significant are
reported as No trends.
Trends in Ozone
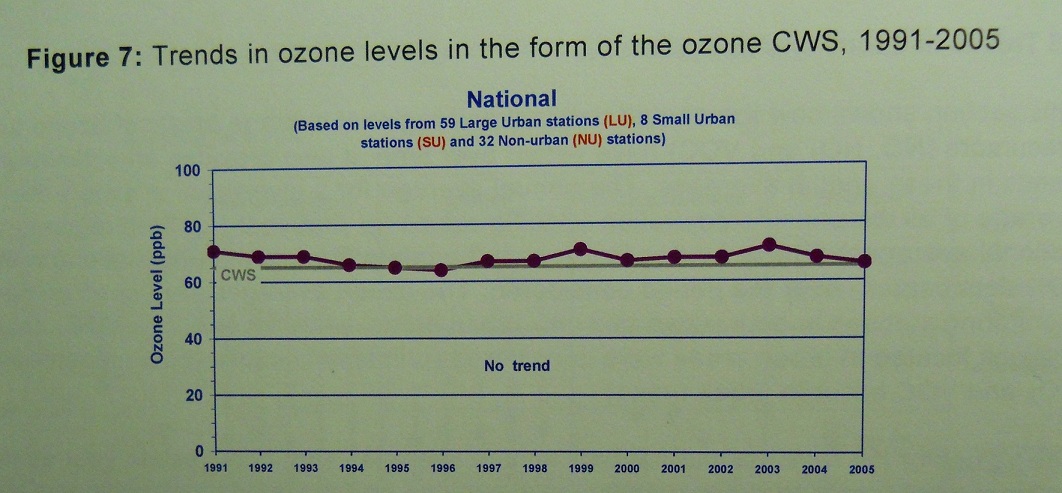
Figure 7 shows how the annual national and regional average
ozone levels in the form of the CWS varied over the 15-year period from 1991 to
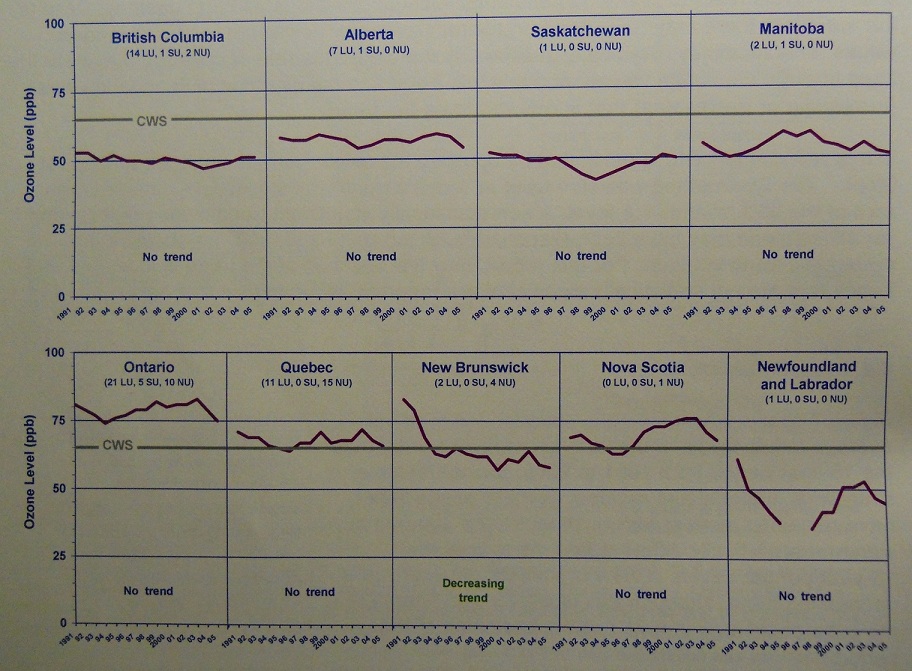
2005. Except for New Brunswick, national and regional average
ozone levels have remained more or less unchanged (i.e. the trends were not
statistically different from zero) over the 15-year period. Levels in New Brunswick experienced a decreasing
trend, although this is largely attributable to the substantial drop in levels
at the beginning of the period.
Figure 7 also shows how the average ozone levels compare to
the numerical value of the CWS. This is
shown only as a relative indication of the magnitude of the measured levels,
and not as an indication of achievement of the CWS. The national average ozone levels were either
just above or just below the CWS over most of the 15-year period. In the four western provinces, the regional
averages have been consistently below the CWS, with the highest levels found in
Alberta. The regional average has been above the CWS
every year in Ontario, and in all but two years
in Quebec.
The "no change” observed in ozone levels over the 15-year period would suggest a corresponding "no improvement” in population health risk associated with ambient ozone levels in the form of the CWS.
In New Brunswick,
the average was above the CWS at the beginning of the period, and has remained
just below it ever since. For Nova Scotia, only one non-urban monitoring station
(located in Kejimkujik
National Park) satisfied
the data completeness criteria. The
ozone levels at this station have been mostly above the CWS. For Newfoundland
and Labrador, the only station considered, located in St. John’s, and has had ozone levels
consistently below the CWS. Overall,
levels in the eastern regions have experienced a downward tendency over the
last three years of the reporting period.
Figure 7: Trends in ozone levels in the form of the
ozone CWS, 1991-2005
Notes:
Indicated levels are
consecutive 3-year averages. The ozone
CWS is shown only as an indication of how the levels compare, on average, to
the Standard and not as an indication of achievement of the CWS over the
years. The direction of the trend in
levels (decreasing or increasing) is indicated only if the obtained value of
the trend is statistically different from zero at the 95% confidence
level. Otherwise it is indicated as "No
trend”. Data generated by Environment Canada
from measurements collected through NAPS.
Large urban (LU) stations are located in communities with populations
over 100,000; Small urban (SU) stations
are located in communities with populations of 100,000 or less; Non-urban (NU) stations are located in areas
where the land use is predominantly rural.
Trends in NOx
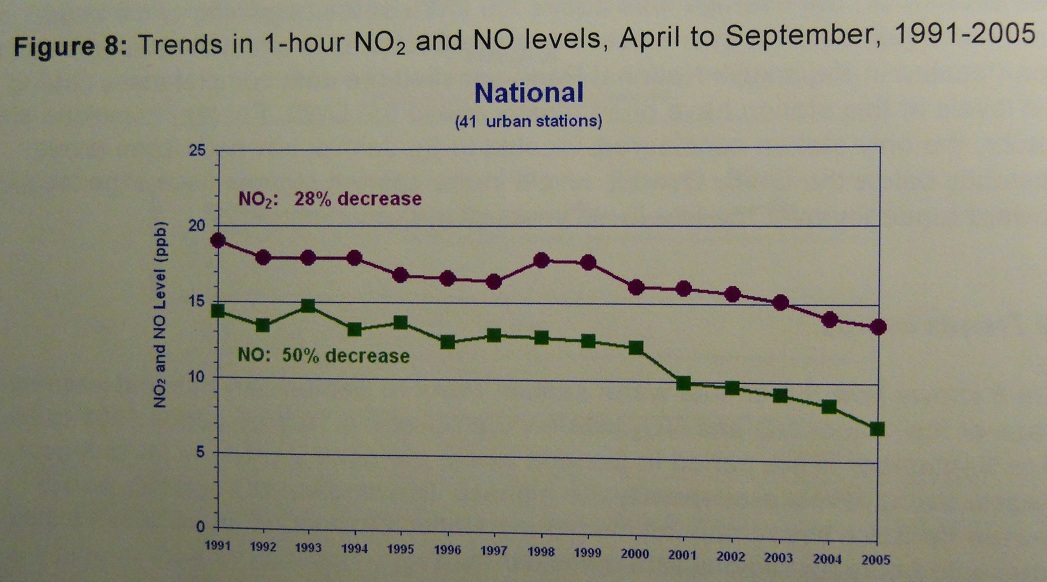
Figure 8 shows how the annual warm season (April to
September) national and regional average of the 1-hour NO and NO2 levels
varied over the 15-year period 1991 to 2005.
April to September is the period in Canada where the peak short-term
(1- to 8-hour averages) ozone levels are typically the highest. The ambient NO and NO2 levels discussed
here are based only on monitoring stations located in urban communities and are
presented only for regions with sufficient data.
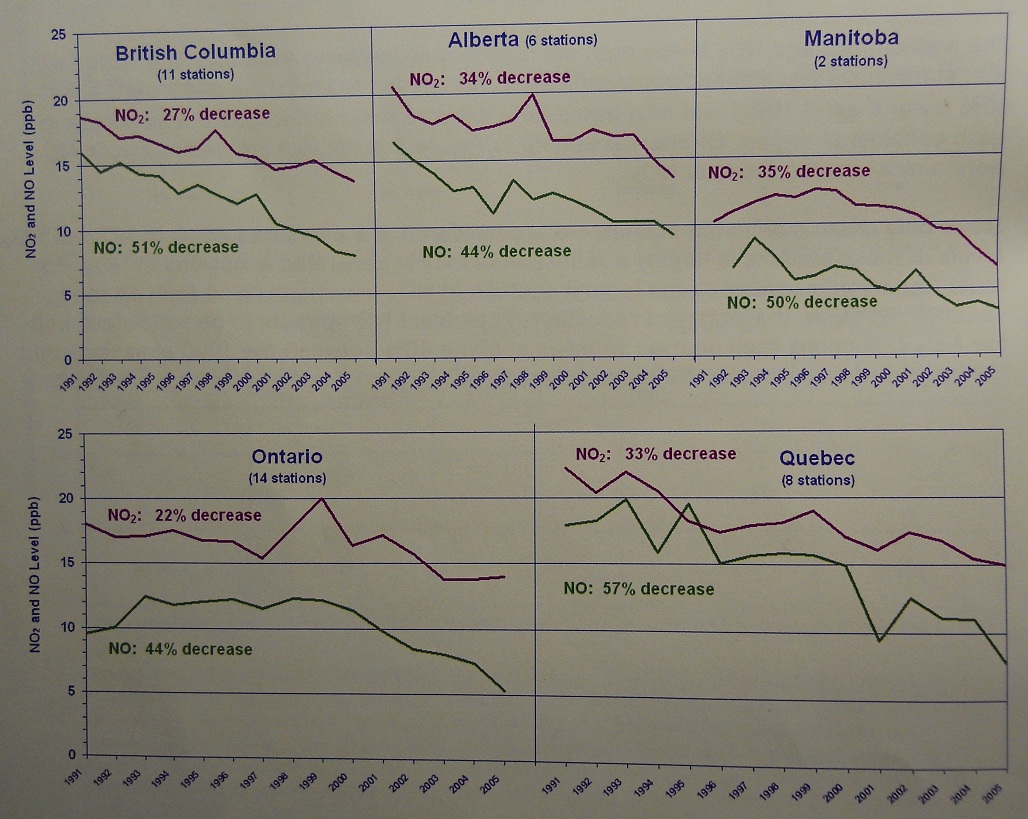
The ambient NO and NO2 levels both decreased
substantially, nationally and regionally, with statistically significant
downward trends. Nationally, NO levels
in 2005 were about 50% lower than in 1991, and NO2 about 30%
lower. Similar reductions are also seen
in each considered region. Of interest
to note in Figure 8 is the fact that reductions in NO were almost double those
of NO2.
Since only urban monitoring stations were considered, the
measured ambient NO and NO2 levels at these stations is largely a
reflection of locally generated emissions of NOx. For most Canadian urban areas the largest
sources of NOx emissions come from on-road vehicles. As such, the observed reductions in ambient
NO appears to be consistent with the NOx reductions from on-road
vehicles of about 40% between the 1990 emissions and the projected emissions
for 2005 (see Section 6.2.2).
Figure 8: Trends in 1-hour NO2 and NO levels, April to
September, 1991-2005
Notes:
Downward trends are
observed in all regions for both NO2 and NO and these trends are all
statistically significant at the 95% confidence level. The indicated percentage changes are the percentage
difference in levels between the end year and the beginning year. In brackets are the number of Large Urban
stations considered. Data were generated
by Environment Canada from measurements collected through NAPS.
Trends in VOC
Ambient VOC levels are not
measured every hour like NO and NO2.
Rather, they are measured over a 24-hour period, with the measurements
taken every three or six days. This
section shows how the annual warm season (April to September) national and
regional average of these levels varied over the period 1993 to 2005 (the
longest period of available data for a larger number of monitoring
stations). The VOC levels discussed here
are based only on monitoring stations located in urban communities and are
presented only for regions with sufficient data.
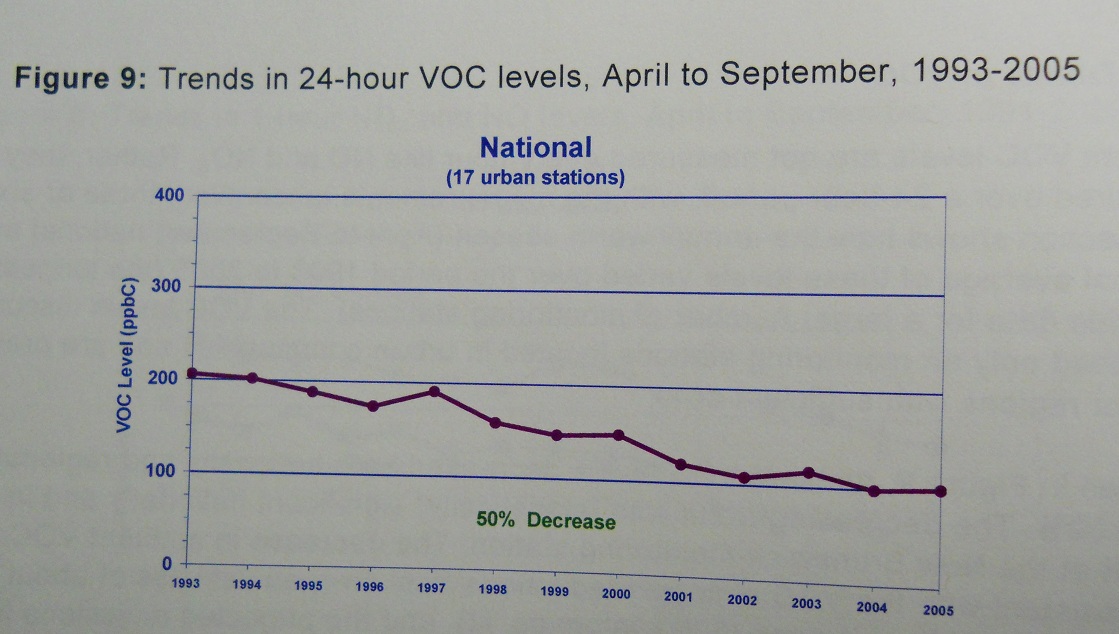
As seen in Figure 9, ambient VOC
levels decreased both nationally and regionally by about 50%. The decreasing trend was (statistically)
significant nationally and in all regions except at the New Brunswick monitoring station. The decrease in ambient VOC appears to be
consistent with the VOC emission reductions from on-road vehicles of about 50%
between the 1990 emissions (676 kilotonnes, kt), and the projected emissions in
2005 (274 kt).
Figure 9: Trends in 24-hour VOC levels, April to
September, 1993-2005
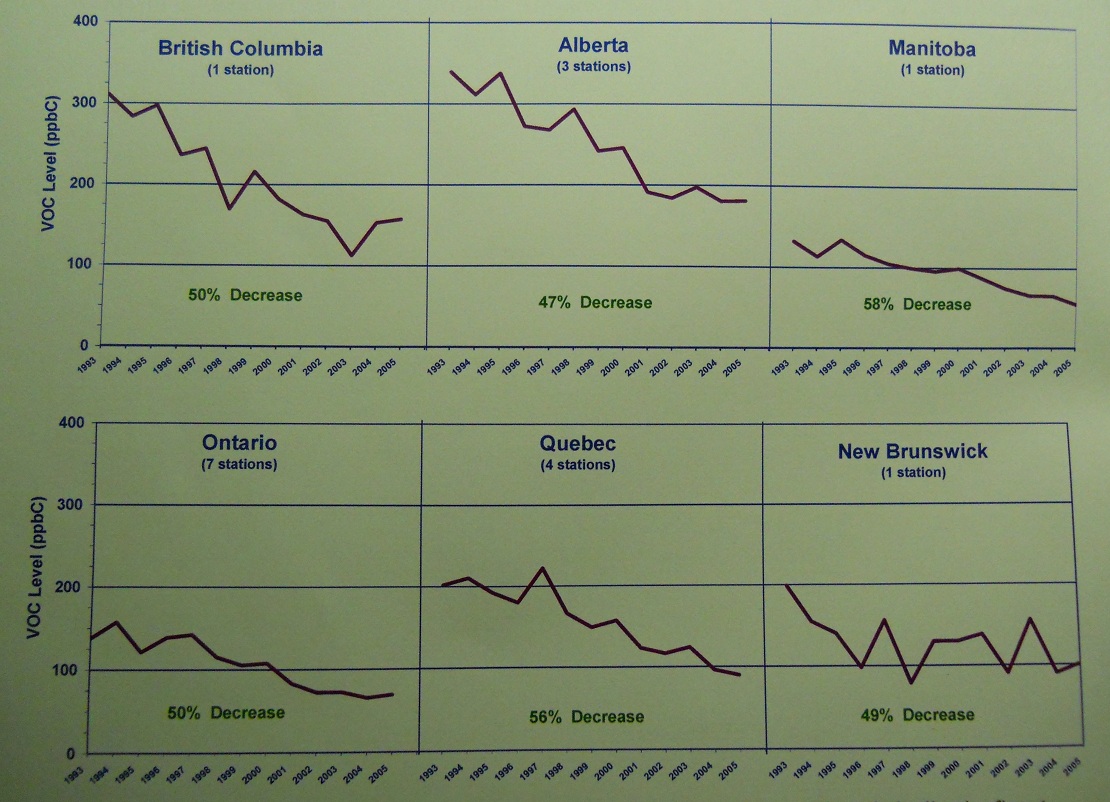
Notes:
Downward trends are
observed in all regions and the trends are all statistically significant (95%
confidence level), except for New
Brunswick where the trend is not statistically
significant. The indicated percentage
changes are the percentage difference in levels between the end year and the
beginning year. In brackets are the
number of Large Urban station considered.
Data were generated by Environment Canada from measurements collected
through NAPS.
Discussion on Trends
As noted above, national average
ozone levels in the form of the CWS (which considers the 4the highest ozone
levels) remained unchanged over the 15-year period form 1991 to 2005. During this time period, ambient levels of
ozone precursors decreased substantially.
The decrease in ambient NO levels at many urban locations, with a
resulting decrease in ozone scavenging (as discussed in section 2), is the most
apparent reason why the 4th highest ozone levels resulting from the
yearly change in meteorological conditions.
These not only have substantial impacts on the higher ozone levels, but
they also mask the long-term trends in ozone levels associated with changes in
emissions of NOx and VOC.
Ozone levels measured at a given
location depend not only on the emissions of the precursors in the community,
but also on a number of other factors such as the prevailing meteorological
conditions, the chemical processes, the direction of the wind and the
associated possible transport of ozone and its precursors into the community
from upwind source regions, and the long-range transport of these
pollutants. As such, comparison between
the local ozone levels and the local ambient levels of its precursors alone is
not sufficient to account for trends in ozone levels.
Modelling and observational
analysis continue to support the view that reductions in both VOC and NOx will
benefit urban areas while NOx reductions may be more effective in lowering
widespread ozone concentrations, benefiting rural areas.