OZONE
LEVELS
Figure 3 shows ozone levels in the form of the CWS for
Canadian communities and reporting sub-areas (RSAs) for the period
2003-2005. Figure 4 shows the CMA, CA,
CSD and RSA boundaries for these communities and areas along with their
associated levels in comparison to the Standard. The levels in these figures are as reported
by provincial and territorial jurisdictions in accordance with the procedures
detailed in the GDAD.
For the period 2003 to 2005, at least 40% of the Canadian
population (approximately 13 million) lived in communities with levels above
the CWS. Most of these were located in Ontario and Quebec. Outside these two provinces, only one
community in British Columbia
and one non-urban area in Atlantic Canada had levels above the CWS. With the exception of Saskatchewan,
Manitoba and
the territories, all other regions had at lease one location with levels within
10% of the CWS (yellow range).
In the western part of Canada, ozone levels varied (Figure
3) from 44 to 68 ppb in British Columbia, 53 to 64 ppb in Alberta, 52 to 54 ppb
in Saskatchewan and Manitoba, and at the single monitored community in the
Northwest Territories, the level was 48 ppb.
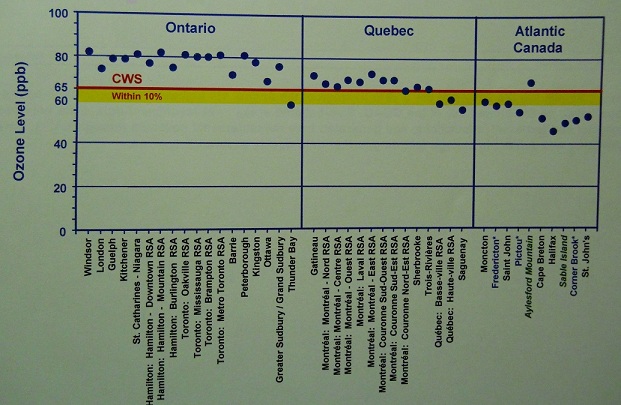
In the eastern part of Canada,
levels varied from 58 to 82 ppb in Ontario, 56
to 73 ppb in Quebec,
and 46 to 69 ppb in Atlantic Canada.
It should be noted that in many communities of Ontario and Quebec,
levels of PM2.5 and ozone above the numerical value of the CWS often
occurred on the same days.
Figure 3: Ozone levels in the form of the CWS,
2003-2005
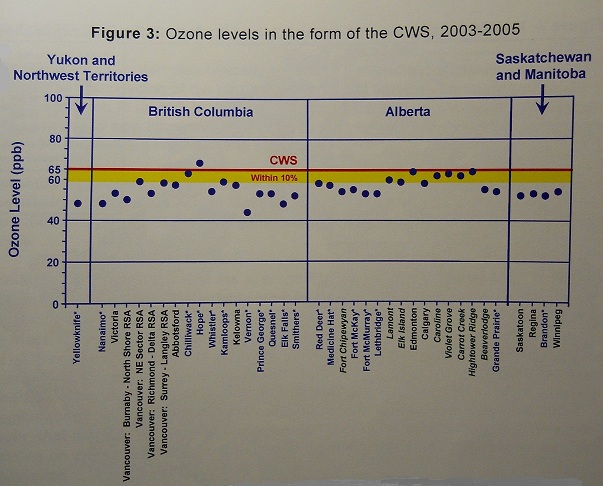
Notes: Shown are the values of the 3-year average of the annual 4th
highest daily maximum 8-hour average ozone based on the procedures in the
GDAD. Yellow band represents levels
within 10% of the CWS. In blue
with* are communities with
populations of 100,000 or less that jurisdictions elected to report on. In green italic are non-urban monitoring stations. Data provided by provincial and territorial
jurisdictions, and generated from measurements collected through NAPS. Data are preliminary and subject to change
following further data quality assurance reviews.
Figure 4: Map of Canada showing ozone levels in the
form of the CWS, 2003-2005
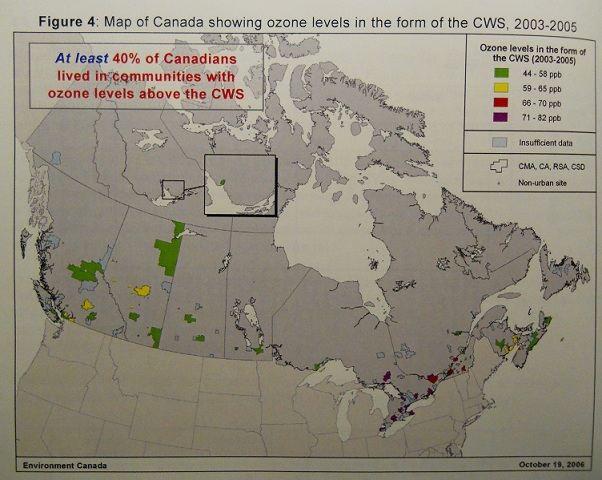
Notes:
Shown are the values
of the 3-year average of the annual 4th highest daily maximum 8-hour
average ozone based on the procedures in the GDAD. Blue-hatched areas have insufficient
data. Data provided by provincial and
territorial jurisdictions, and generated from measurements collected through
NAPS. Data are preliminary and subject
to change following further data quality assurance reviews.
Particles typically consist of a mixture of substances. Information on the measured composition of
the particles is important as it can be used in a weight-of-evidence approach
to identify the source-categories contributing to the ambient PM mass. Health research is also increasingly pointing
to the need to identify the PM components that may be responsible for the
health effects.
Detailed measurements of the main PM specie on a routine
basis are relatively recent and are limited in coverage across Canada. This section presents results of a PM
composition analysis for the current locations where PM speciation samplers are
operated routinely.
Figure 5 provides an overview of the average PM2.5
composition for stations in British Columbia (B.C.), Ontario,
Quebec and New Brunswick from February 2003 to August
2005. During this period, total carbon
(elemental + organic) was a major component of PM2.5 mass in each
location, followed by sulphate and nitrate (in their ammonium-related
forms). Other minor components were soil
elements and salt. Secondary PM2.5
such as sulphate, nitrate and a portion of the organic carbon typically account
for one half or more of the PM2.5 mass in eastern locations. The B.C. locations generally reflected a
greater predominance of total carbon than the eastern Canada
locations. It should be noted, however,
that the actual day-to-day composition may differ substantially from this
average, depending on the sources that contributed to the PM2.5 mass
and the weather conditions that prevailed.
Figure 5: Average PM 2.5 composition for
selected stations, 2003-2005
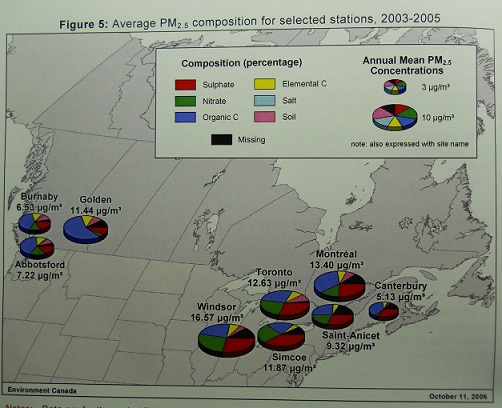
Notes:
Data are for the
period February 2003 to August 2005. Data
generated by Environment Canada from measurements collected through NAPS. Sulphate and nitrate were assumed to be in
their ammonium-related forms. For Simcoe
and Saint-Anicet, the Soil fraction is part of "Missing,” as estimates of the soil
fraction were not possible for these two locations. The same applied for most soil measurement at
Canterbury. Simcoe, Saint-Anicet and Canterbury are all in non-urban areas. The PM composition analysis is based on
widely used mass-reconstruction methods.
Annual Variation in
PM2.5 Levels
It is important to know the long-term trends in the ambient
levels of PM2.5 across Canada. However, daily monitoring of ambient PM2.5
levels across all regions of Canada
did not begin until the late 1990s, aided by the development and implementation
of the CWS. As such, a sufficiently
long-term record of data does not exist to enable the evaluation of robust
trends in PM2.5 levels.
However, a qualitative indication of how the levels varied over the ears
is still possible. This is accomplished
here by presenting the regional range in PM2.5 levels in the form of
the CWS for the period 2001 to 2005. The
regional range for a given year is defined as being the lowest and highest
values of all considered station-specific levels in the form of the CWS for
that year, along with the average of all the station-specific levels.
From the late 1990s to 2005, the number of communities and
areas covered by PM2.5 monitoring grew rapidly. To provide a broad indication of the PM2.5
levels that prevailed in the regions, the number of communities and areas
considered here was not constant, but was rather allowed to vary yearly
depending on the availability of the data.
For this reason, and also because the PM2.5 levels presented
here are not to be used for CWS achievement evaluation, the number of
communities and areas considered in this section are larger than those
considered in Section 4.2. As such, the
information in this section is not directly comparable to the information in
Section 4.2.
Results
Figure 6 indicates the annual regional range (as defined
above) in PM2.5 levels in the form of the CWS.
For most regions of Canada,
average PM2.5 levels ranged from 15 to 20 µg/m3. Notable exceptions are Ontario
and Quebec,
where regional averages either neared the CWS or were above it. Ontario, Quebec and British
Columbia are the three regions where the highest PM2.5
level was above the CWS in every year.
Elsewhere, the highest level was appreciably below the CWS except in Alberta and New
Brunswick, where the highest levels approached the
CWS in some years.
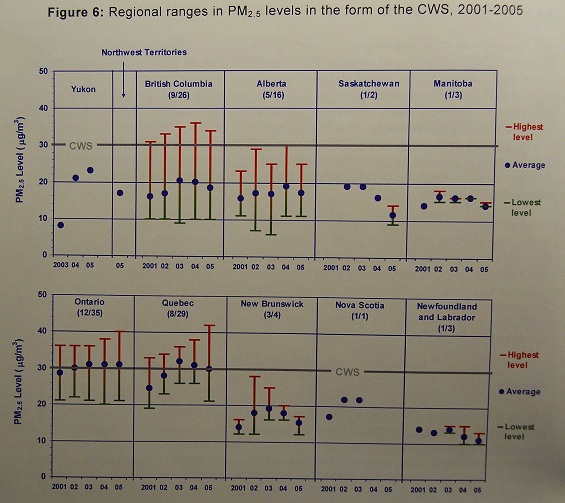
Notes:
The PM2.5 levels shown are from
continuous monitors, consisting of the TEOM® (the majority) and BAM
monitors. The highest and lowest levels
shown are values of the 3-year average of the annual 98th
percentiles of the daily 24-hour PM2.5. These 3-year averages were computed for each
monitoring station considered in the region and the highest and lowest of these
were then extracted. The Average
is simply the average of all the station-specific 3-year averages in
the region. The numbers in brackets
below the region’s name (N1/N2) are the number of monitoring stations
considered during the first (N1) and last (N2) year of the period; the
number of stations considered for in-between years may have been fewer or more
than these. Years with only a circle and
no range shown indicates that only one station was considered, and therefore no
range is possible. The monitoring method
configuration may have changed over the years in some regions; this may have affected the monitoring results
and may have contributed to the annual variation in levels. Data generated by Environment Canada from
measurements collected through NAPS.