AMBIENT LEVELS AND TRENDS
Canadian
Ambient Data Source
The Canadian ambient data was collected through the National
Air Pollution Surveillance (NAPS) Network, a joint federal, provincial,
territorial and municipal program. Data
from both NAPS-designated sites and other sites operated or supervised by
provincial, territorial and municipal jurisdictions are also included. Data from ozone monitors operated by the
Canadian air and Precipitation Monitoring Network (CAPMoN) are also used. CAPMoN is operated by Environment Canada.
PM2.5
Levels
Figure 1 shows the PM2.5 levels in the form of
the CWS for Canadian communities and reporting sub-areas (RSAs) for the period
2003-2005. Figure 2 shows the CMA, CA,
CSD and RSA boundaries for these communities and areas along with their
associated levels in the form of the Standard.
The levels in these figures are as reported by provincial and
territorial jurisdictions in accordance with the procedures detailed in the
GDAD.
For the period 2003 to 2005, at least 30% of the Canadian
population (approximately 10 million) lived in communities with levels above
the CWS. Most of these were located in Ontario and Quebec. Outside these two provinces, only two
communities within 10% of the Standard were also primarily located in Ontario and Quebec.
In the western part of Canada, PM2.5 levels
varied (Figure 1) from 17 to 23 µg/m3 in Yukon and the Northwest
Territories, 10 to 34 µg/m3 in British Columbia, 11 to 22 µg/m3
in Alberta, and 9 to 15 µg/m3
in Saskatchewan and Manitoba. In the
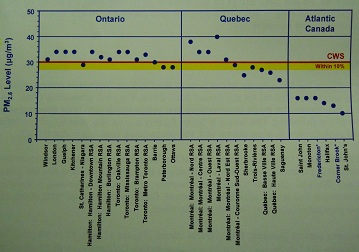
eastern part of Canada,
levels varied from 28 to 34 µg/m3 in Ontario,
23 to 40 µg/m3 Quebec,
and 10 to 16 µg/m3 in Atlantic Canada.
Figure 1: PM 2.5 levels in the form of the
CWS, 2003-2005
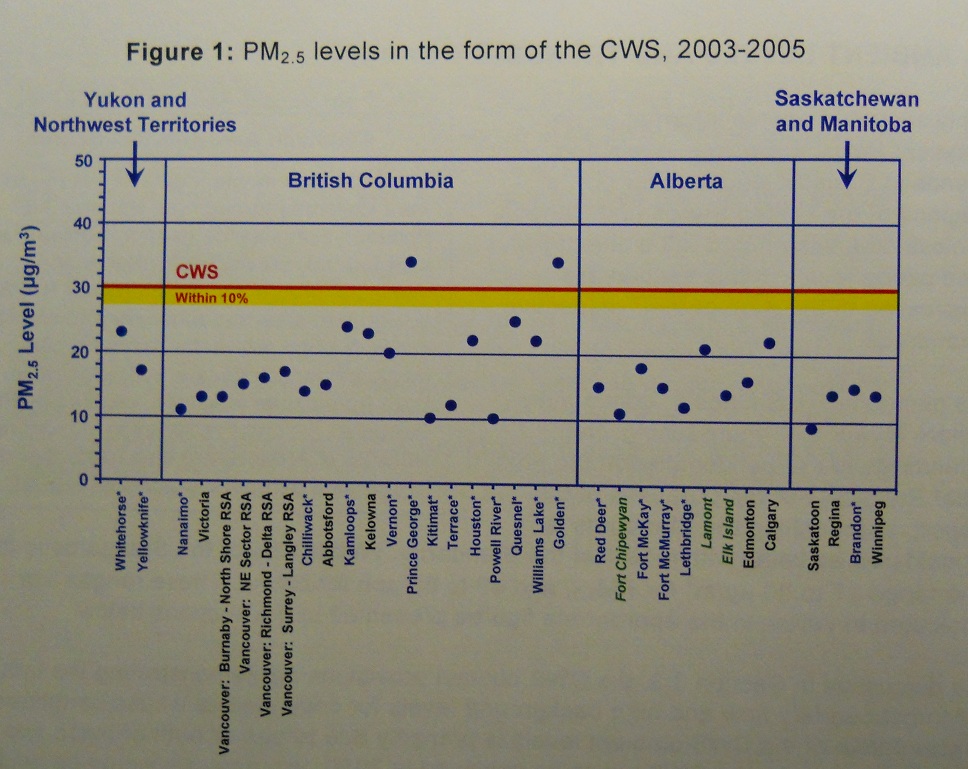
Notes: Shown are the values
of the 3-year average of the annual 98th percentiles of the daily
24-hour PM2.5 based on the procedures in GDAD. Yellow band represents levels within 10% of
the CWS. Values for Kitchener
and Guelph are based
on two years of data. The PM2.5 levels
shown are from continuous monitors, consisting of the TEOM® (the majority) and
BAM monitors. In blue with * are communities with populations of 100,000 or less that
jurisdictions elected to report on. In green italic are non-urban monitoring stations. Data provided by provincial and territorial
jurisdictions, and generated from measurements collected through NAPS. Data are preliminary and subject to change
following further data quality assurance reviews.
Figure 2: Map of Canada showing PM2.5
levels in the form of the CWS, 2003-2005
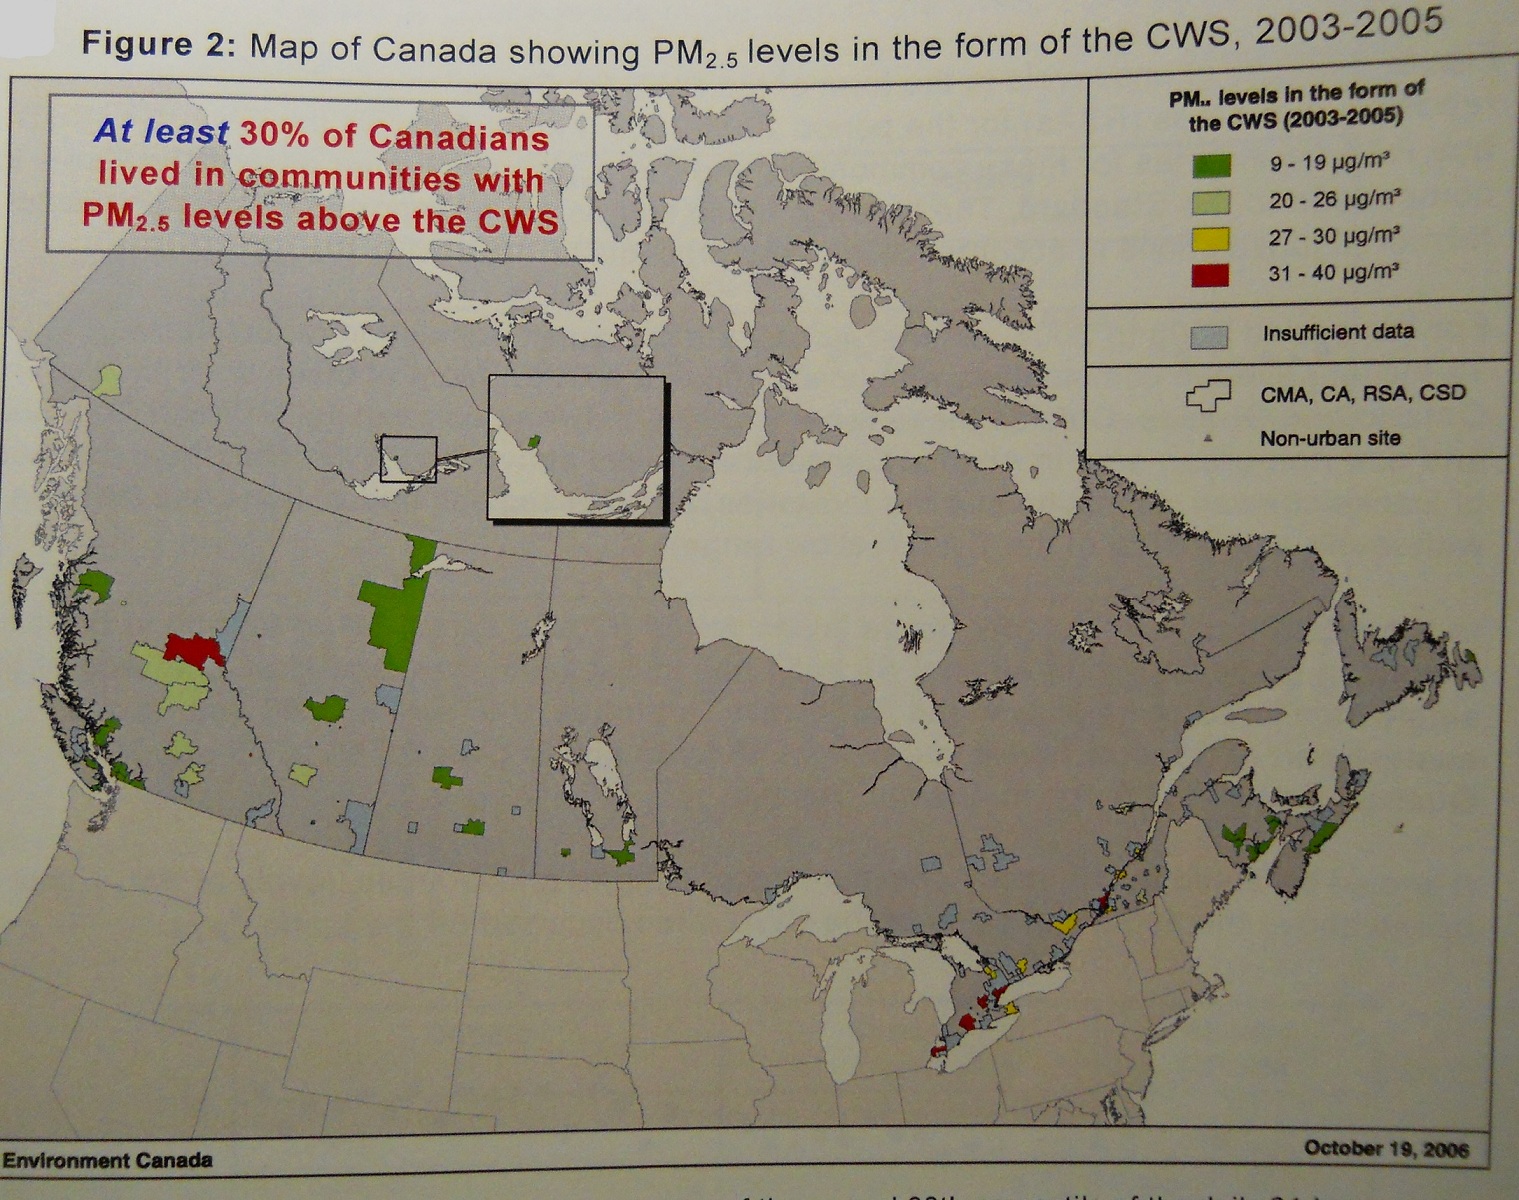
Notes:
Shown are the values
of the 3-year average of the annual 98th percentile of the daily
24-hour average PM2.5 based on the procedures in the GDAD. Values for Kitchener
and Guelph are
based on two years of data. Blue-hatched
areas have insufficient data. Data
provided by provincial and territorial jurisdictions, and generated from
measurements collected through NAPS.
Data are preliminary and subject to change following further data
quality assurance reviews.